Visual Solution Mapping
Create comprehensive solution maps by simply selecting the Smartsheet assets that make up your solution. Visualize complex relationships and dependencies in an interactive hierarchical diagram.
Solution Maps Made Simple
Select your artifacts, and Huddle automatically creates beautiful interactive diagrams showing how your Smartsheet assets connect and depend on each other.
Field Service Management Solution Map
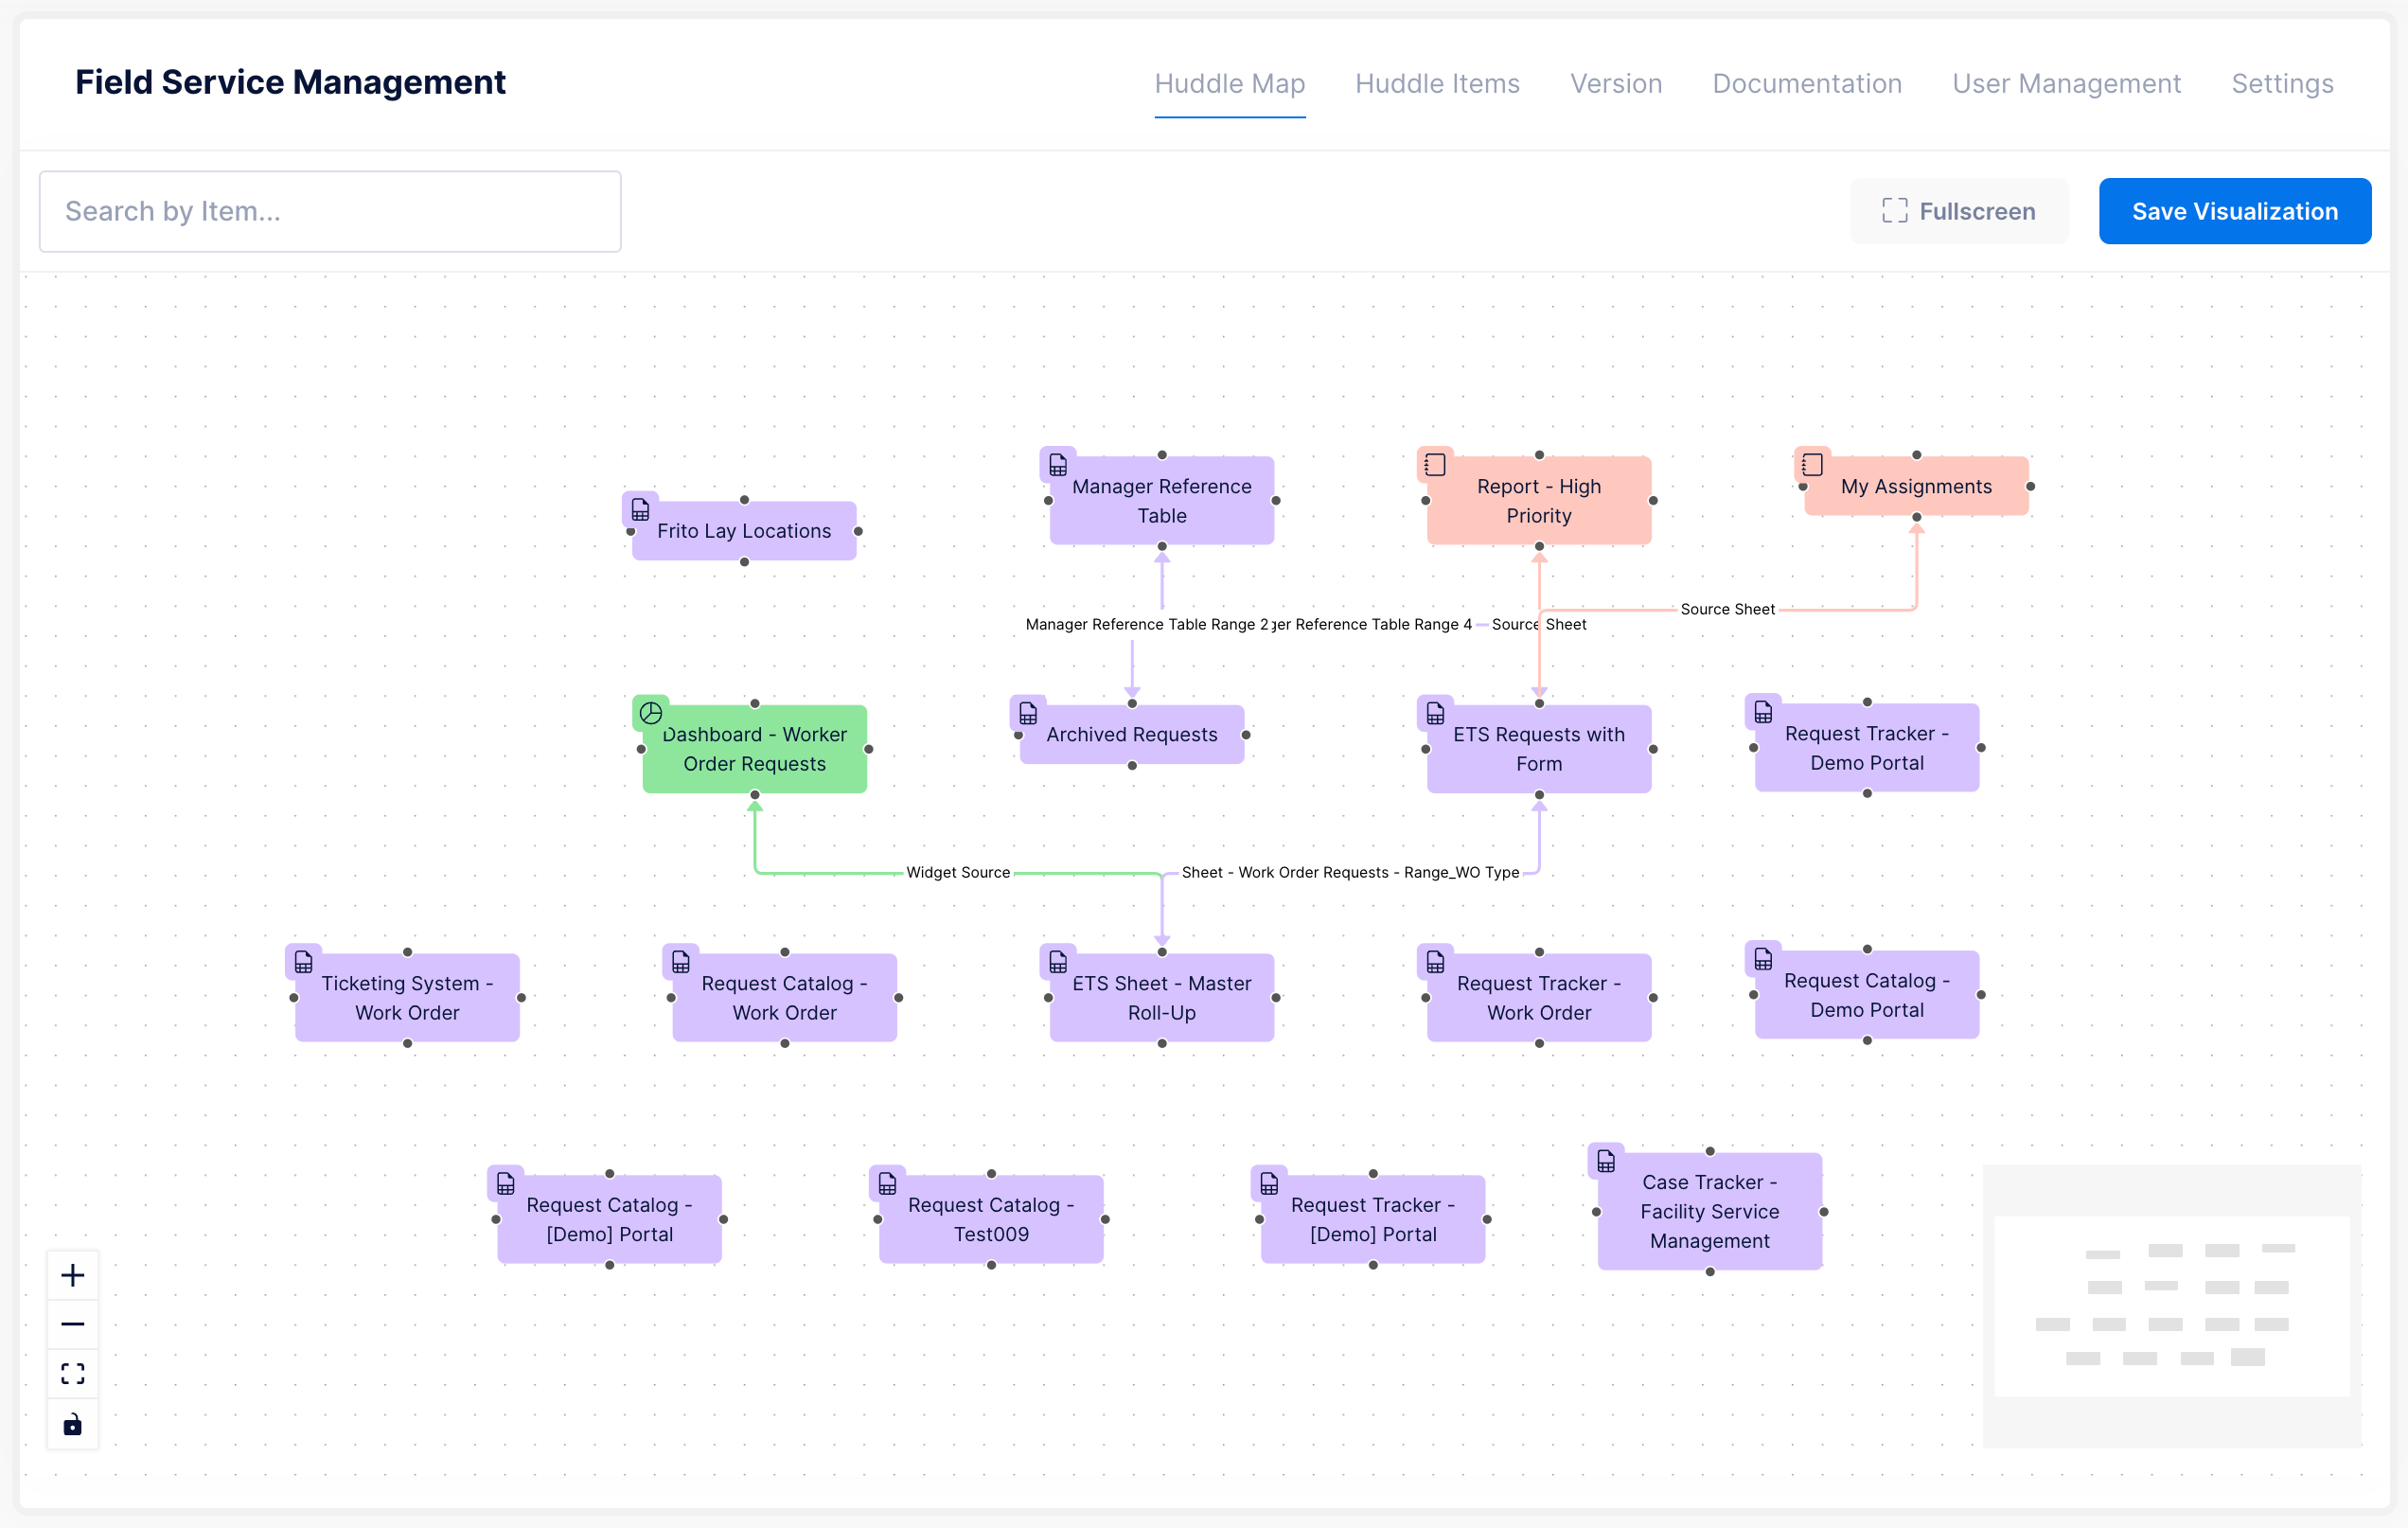
Intelligent Asset Mapping
Huddle automatically detects relationships and creates intelligent visualizations
Automatic Relationship Detection
Huddle analyzes your Smartsheet assets and automatically identifies dependencies, data flows, and relationships between sheets, reports, and dashboards.
Hierarchical Layouts
Smart algorithms arrange your assets in logical hierarchies, showing clear data flows from source sheets through reports to final dashboards.
Interactive Customization
Drag nodes to reposition, add custom labels and connections, adjust layouts, and save different views for various stakeholder audiences.
Multi-Device Views
Solution maps are responsive and optimized for viewing on any device, with touch-friendly controls for mobile and tablet interactions.
Export & Sharing
Export solution maps as high-resolution images or PDFs for documentation, presentations, and stakeholder communications.
Real-time Updates
Maps automatically update when you add or remove assets from your solution, keeping your documentation always current and accurate.
All Smartsheet Asset Types
Visualize relationships across every type of Smartsheet asset in your solution
Sheets
Source data sheets, working spreadsheets, and master data repositories that form the foundation of your solutions.
Reports
Filtered views, aggregated data reports, and summary tables that transform raw data into actionable insights.
Dashboards
Executive dashboards, KPI displays, and visual analytics that present data in compelling, interactive formats.
Templates
Reusable templates, forms, and standardized workflows that enable consistent processes across your organization.
Solution Mapping Use Cases
From simple workflows to complex enterprise solutions, visualize any Smartsheet-based system
Project Portfolio Management
Map project hierarchies from master portfolio sheets through individual project trackers to executive dashboard views, showing resource dependencies and reporting chains.
Customer Onboarding Workflow
Visualize the complete customer journey from initial intake forms through process tracking sheets to completion dashboards and success metrics.
Financial Planning System
Map budget planning workflows from departmental input sheets through consolidation reports to final budget dashboards and variance analysis.
Compliance Management
Document compliance workflows from requirements tracking through audit procedures to compliance reporting and regulatory dashboards.
Product Development Pipeline
Visualize product development from idea intake through feature tracking to release planning and product performance dashboards.
Vendor Management System
Map vendor relationships from qualification sheets through performance tracking to contract management and procurement dashboards.
Clear Communication, Better Outcomes
Solution maps transform complex Smartsheet architectures into clear, understandable visuals
Ready to Map Your Solutions?
Start creating visual solution maps that make your Smartsheet architecture crystal clear